▤
What was planned?
Start with the committed stories and story points, not a rewritten version of the plan.
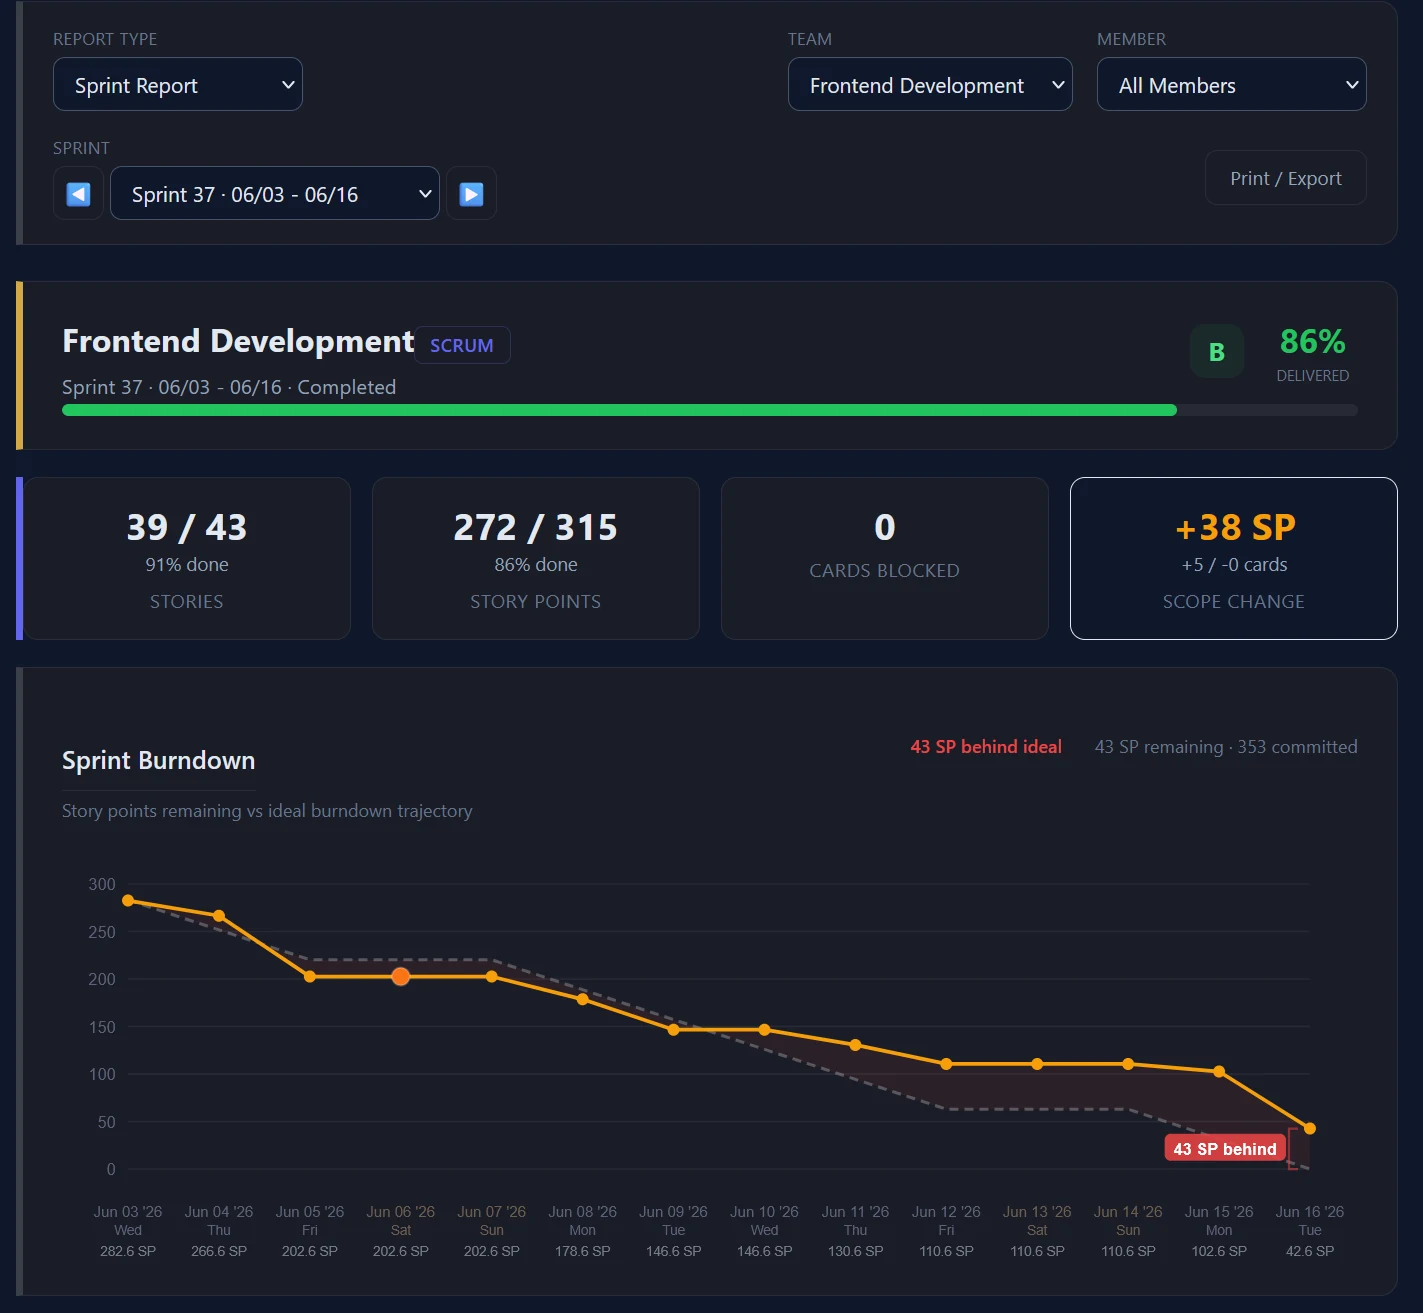
An example sprint delivered 86% with +38 story points of scope change. SprintMetrix connects commitments, burndown, worklogs and delivery history so the final percentage isn’t the whole story.
Scrum + Kanban · Actual product UI · Example sprint data
THE STORY BETWEEN START AND DONE
A finish-line percentage is useful. But it doesn't explain the work that was added, moved, recorded late or carried into the next sprint.
Start with the committed stories and story points, not a rewritten version of the plan.
See scope added or removed, blocked work, carryover and changes in the sprint record.
Put daily activity and worklog timing alongside the delivery result.
Turn discrepancies into specific questions worth investigating—not automatic conclusions about people.
REAL PRODUCT. SIMULATED DEMO DATA.
This is the existing Agile reporting product—not a concept dashboard. Open a screenshot or explore the live demo to see how the pieces connect.
The Sprint 37 example shows 86% delivery, 38 story points of scope change and 43 story points behind the ideal burndown. Explore how the sprint evolved, not just how it ended.
ANOTHER SPRINT. A DIFFERENT RESULT.
The Sprint 43 report shows why delivery percentage and the path through a sprint deserve to be seen together. Different outcomes. The same questions about commitment and change.
Inspect Sprint 43 Example product reports; figures describe the displayed sprints, not customer outcomes.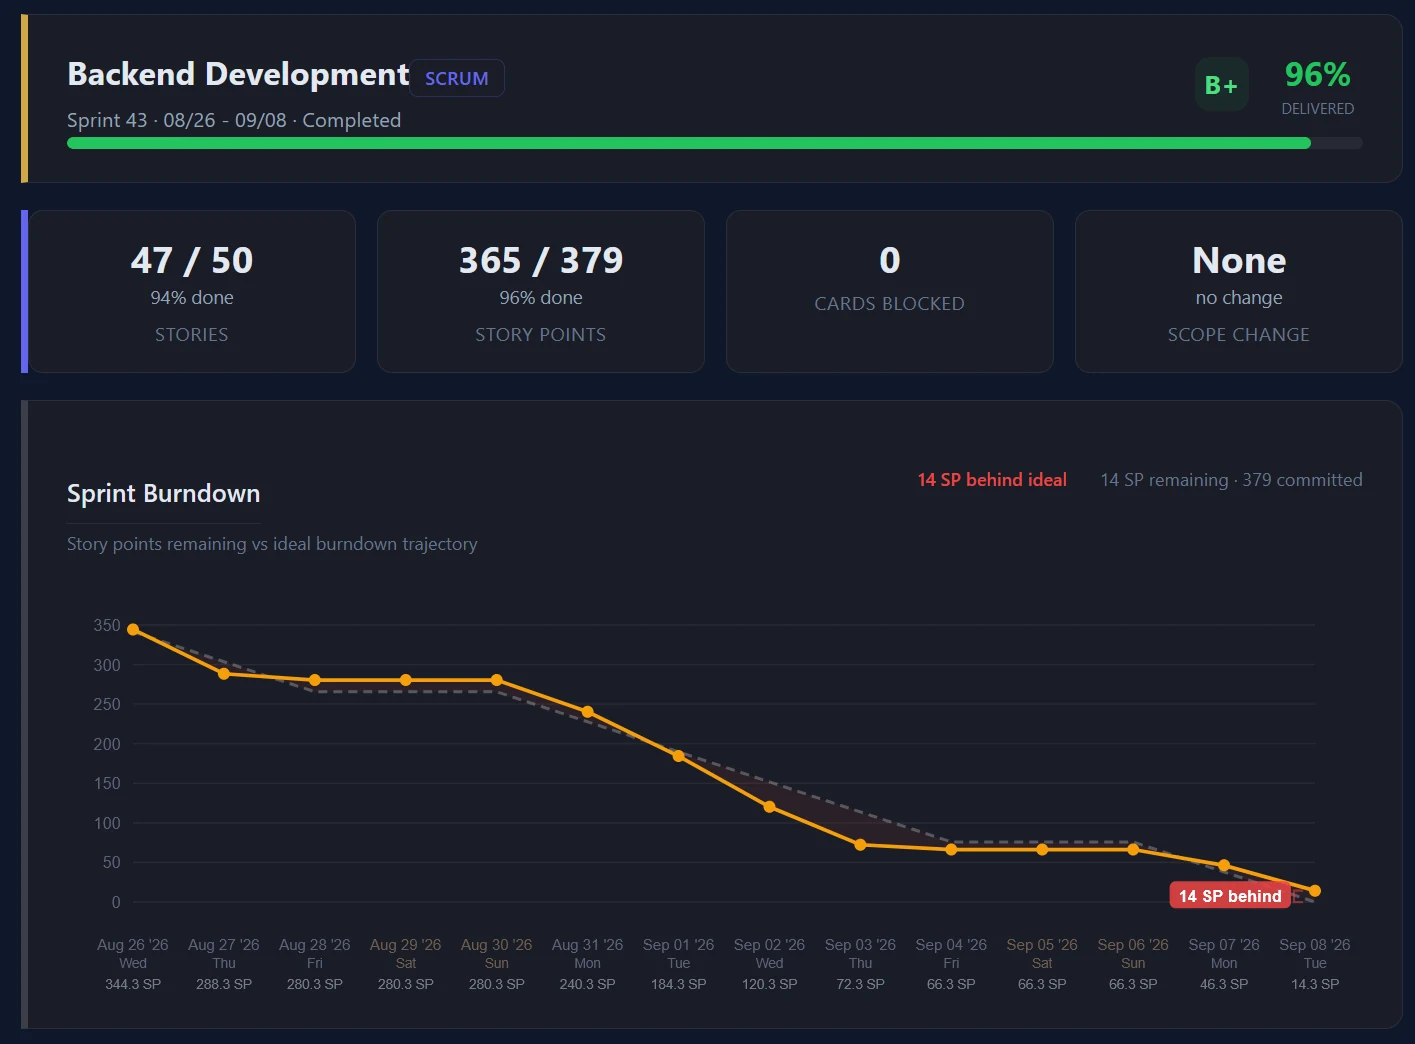
THE DETAILS WORTH LOOKING INTO
SprintMetrix connects delivery results to changes and recorded activity, helping leaders ask better questions before the next planning meeting.
Keep a record of what was added or removed and how the commitment changed.
Spot timing patterns that may need clarification instead of relying on a final hours total.
Surface unusual clusters of completions or recorded work for review.
See cards moving backward and work that did not stay done.
ONE SPRINT IS A SNAPSHOT
Look beyond this sprint. Compare velocity, delivery consistency and scope movement over time, then bring the story to leadership.
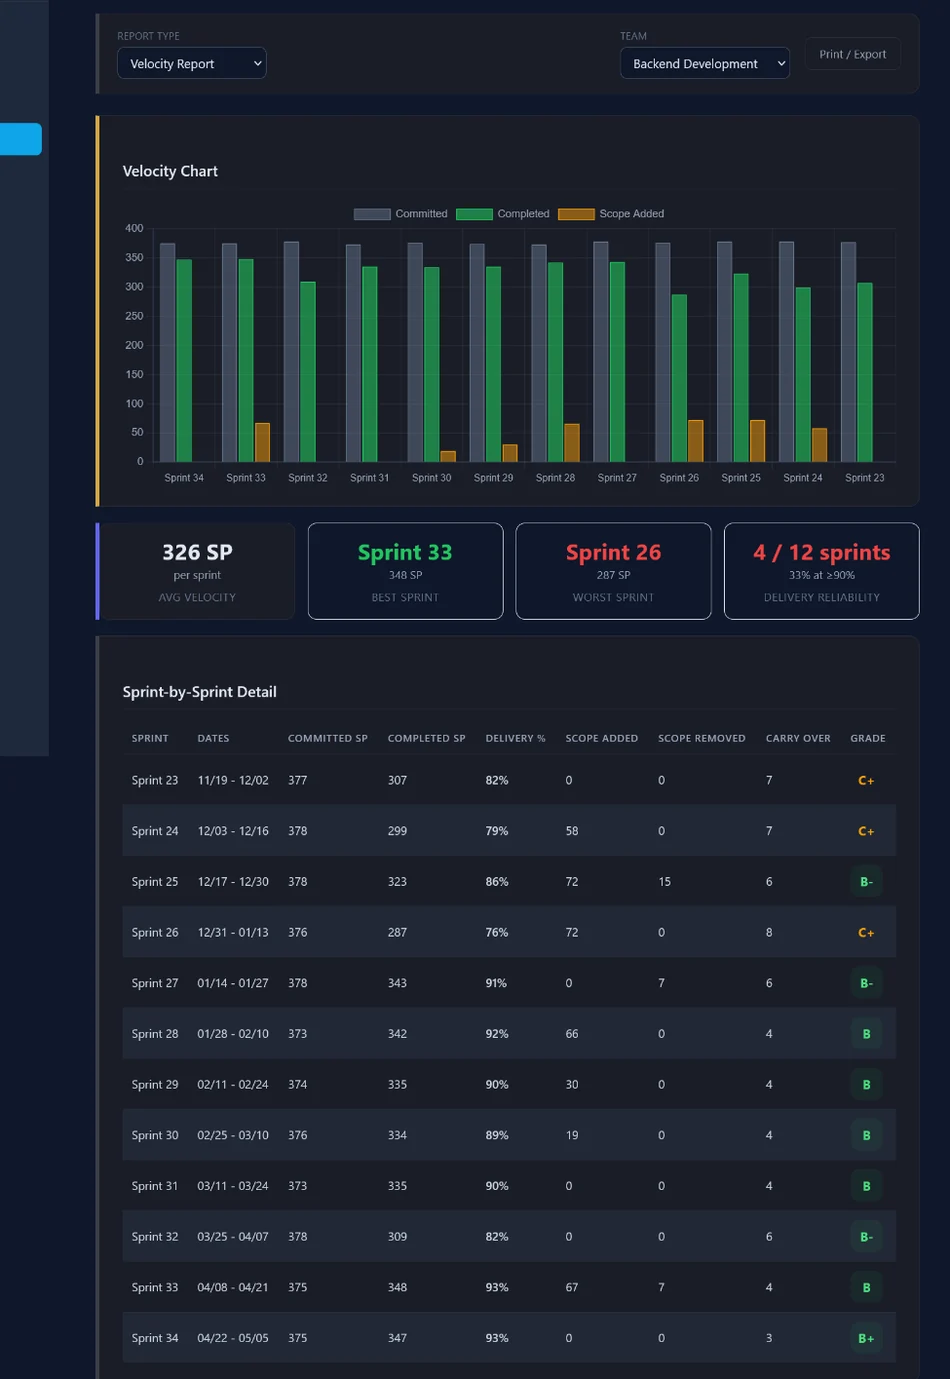
Review committed and completed work, sprint-by-sprint delivery and scope creep together. An unusually smooth sprint is worth understanding just as much as a difficult one.
SAME ORGANIZATION. DIFFERENT WAYS OF WORKING.
Your teams don't all work the same way. SprintMetrix brings their reporting into one leadership view without pretending every team runs a sprint.
Commitment, burndown, scope movement, carryover, historical velocity and the daily activity behind delivery.
See Kanban teams alongside Scrum teams in leadership reporting and explore the work history behind their status.
MADE FOR THE REVIEW MEETING
The executive view brings team status, delivery and accountability signals into one place. Drill into the supporting sprint details when a number raises a question.
See the live demo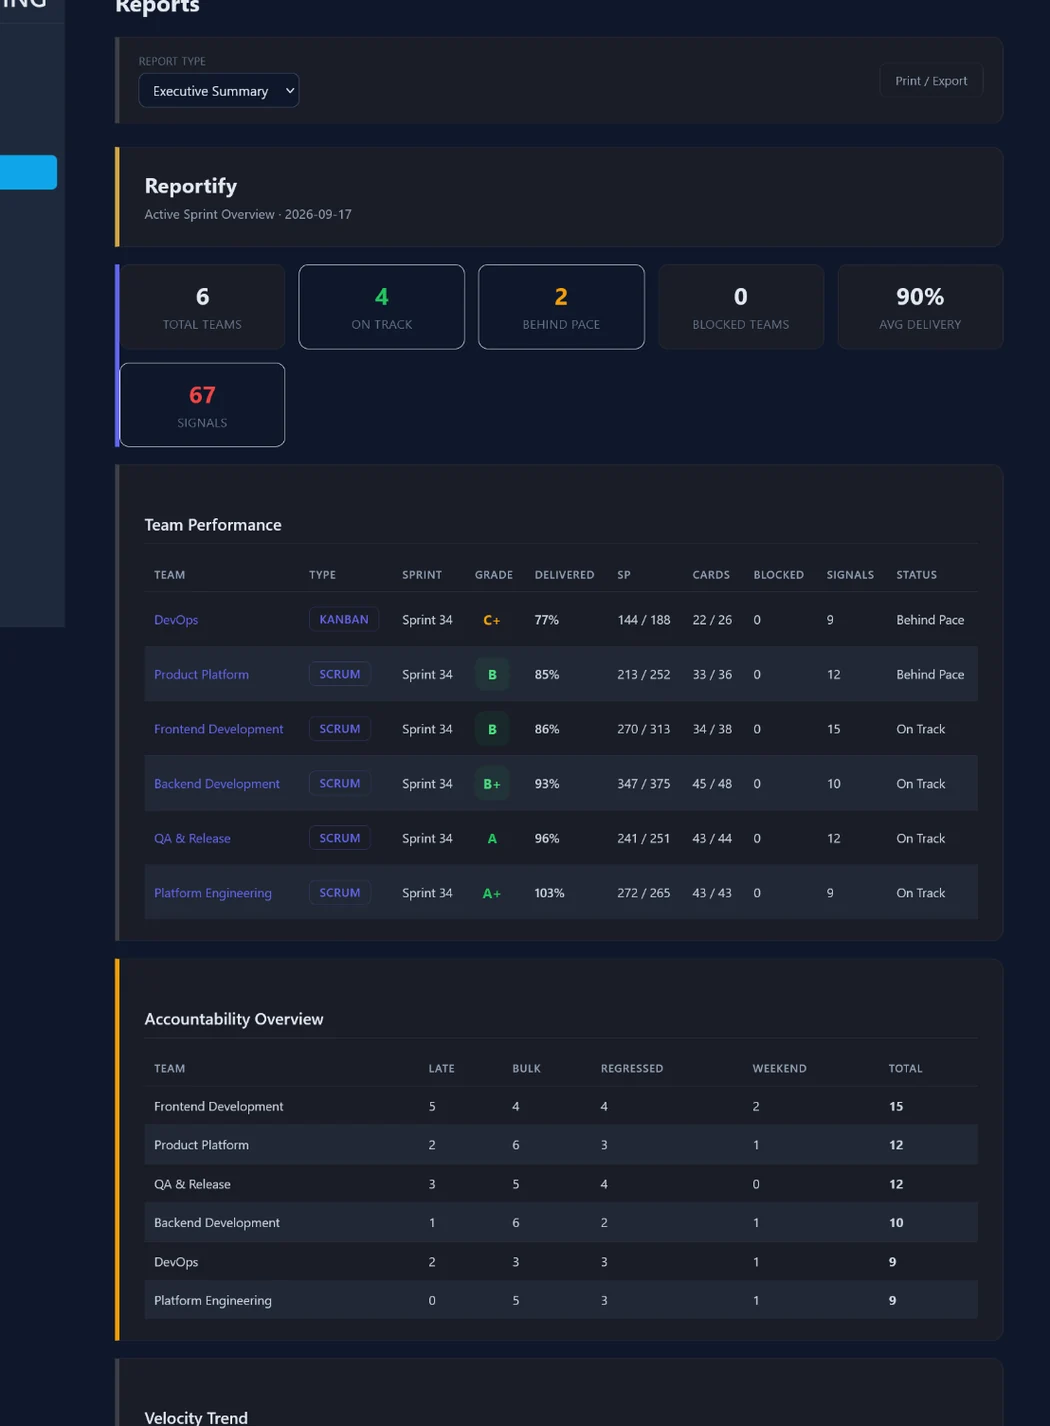
YOUR JIRA DATA ALREADY KNOWS A LOT.
Try SprintMetrix at your own pace. When you're ready to talk about your teams and reporting, we'll be here.